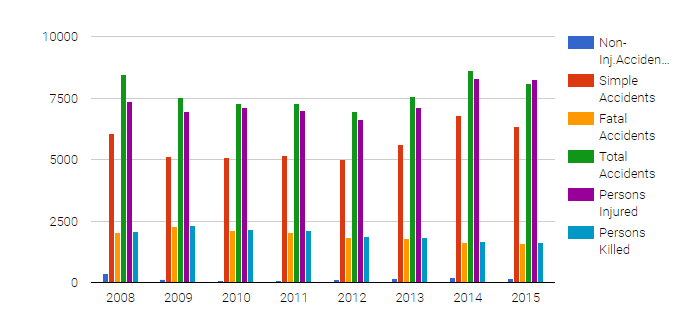
The graph shows year wise accidents stats in Delhi.
| Year | Non-Inj.Accidents | Simple Accidents | Fatal Accidents | Total Accidents | Persons Injured | Persons Killed |
|---|---|---|---|---|---|---|
| 2008 | 362 | 6058 | 2015 | 8435 | 7343 | 2093 |
| 2009 | 131 | 5113 | 2272 | 7516 | 6936 | 2325 |
| 2010 | 63 | 5093 | 2104 | 7260 | 7108 | 2153 |
| 2011 | 71 | 5162 | 2047 | 7280 | 6975 | 2110 |
| 2012 | 115 | 5000 | 1822 | 6937 | 6639 | 1866 |
| 2013 | 169 | 5619 | 1778 | 7566 | 7098 | 1820 |
| 2014 | 209 | 6785 | 1629 | 8623 | 8283 | 1671 |
| 2015 | 160 | 6343 | 1582 | 8085 | 8258 | 1622 |
Data source: https://delhitrafficpolice.nic.in/about-us/statistics/
![]()

Facebook Comments


Puneet Verma is a passionate traveler, environment blogger, techie and nature lover. He owns a beautiful community of 400+ environment enthusiasts at missiongreendelhi.com. Join MGD's #Delhikabagh latest environment awareness campaign and tag @missiongreendelhi and #Delhikabagh on Facebook and Instagram with your environment friendly posts.
Reach out to Puneet @9910162399 for collaboration for making Delhi green and clean.
Reach out to Puneet @9910162399 for collaboration for making Delhi green and clean.